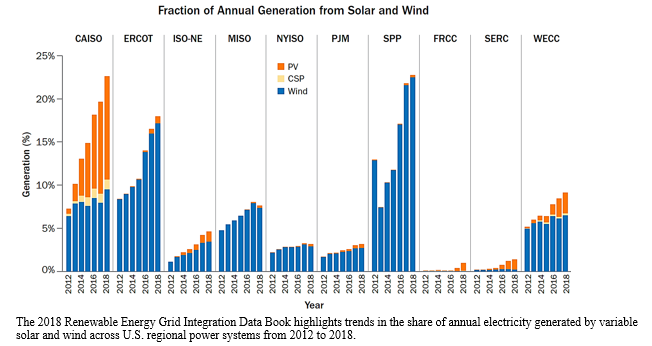
| Latest Grid Data Book Reveals Key Trends in Renewable Integration, published by NREL and LBNL. |
| 2018 Edition of the Biennial Data Compilation Identifies Changes in Markets and Power System Operations as Renewables are Integrated onto the Grid |
| The share of variable renewable energy (VRE)—mainly solar and wind—generation on U.S. regional power systems more than doubled on average from 2012 to 2018, according to the newly released 2018 Renewable Energy Grid Integration Data Book. Published biennially by the U.S. Department of Energy’s (DOE’s) National Renewable Energy Laboratory (NREL) and the Lawrence Berkeley National Laboratory (LBNL) on behalf of DOE’s Office of Energy Efficiency and Renewable Energy, the Renewable Energy Grid Integration Data Book identifies the status and key trends of renewable energy grid integration in a highly visual format. The Data Book includes key charts and data on renewable energy capacity and generation; wholesale and retail electricity markets; power system operations; transmission; and retail electricity markets. |

| Produced by NREL’s Strategic Energy Analysis Center and LBNL’s Electricity Markets and Policy Group, the Renewable Energy Grid Integration Data Book is intended to provide an overview of selected grid integration metrics that reflect recent changes to the operation and composition of the power system as VRE sources increase their shares of electricity supply. “These grid integration metrics indicate how much VRE is currently being integrated onto the grid throughout the regional U.S. power systems,” said NREL Analyst Yinong Sun, lead author of the Data Book. “We also highlight trends that may reflect the extent of the challenges associated with integrating VRE generation onto the grid.” The data and content presented focus on the year 2018. Some historical data and content are included to provide context for the broader electric sector and market environment for VRE integration. Other key insights from the data include: |
- Among all U.S. regions, the annual average VRE penetration as a fraction of total generation in 2018 was led by the Southwest Power Pool (SPP), with 22.6%, the California Independent System Operator (CAISO), with 22.6%, and the Electric Reliability Council of Texas (ERCOT), with 17.9%.
- Wind was the dominant source in SPP (98.8% of all VRE generation) and ERCOT (95.5% of all VRE generation), and solar was the dominant source in CAISO (53.0% of all VRE generation was from photovoltaics [PV] and 5.0% from concentrating solar power).
- In 2018, maximum hourly penetration of utility-scale wind and solar generation reached nearly 62.6% in CAISO (on April 28 when it consisted of 43.1% solar and 19.5% wind), 62.5% in SPP (on April 29, with all generation from wind), and 54.3% in ERCOT (on December 27, with all generation from wind).
- The highest annual average wind curtailment rate was observed in 2018 in MISO (4.2%), followed by ISO-NE (2.7%), ERCOT (2.5%), NYISO (1.7%), SPP (1.3%), and PJM and CAISO (0.5%).
- In CAISO, average annual curtailment levels of solar PV increased from 0.8% of its total generation in 2015 to 1.5% in 2018, as its penetration increased from 7.3% in 2015 to 13.1% in 2018.
- ERCOT had over 8% of solar PV curtailment in 2018.
| NREL is the U.S. Department of Energy’s primary national laboratory for renewable energy and energy efficiency research and development. NREL is operated for the Energy Department by The Alliance for Sustainable Energy, LLC. |

Leave a Reply
You must be logged in to post a comment.